300+ Agile & Scrum Statistics
")
Trying to convince your team or CEO to go Agile? Need some hard data to back up your claims? You’ve come to the right place! We’ve combed the internet for all the agile statistics we could find, including data on Scrum, Kanban, metrics, meetings, and more.
So whether you’re writing a blog, a research paper, or preparing a deck on agile effectiveness, we’ve got what you’re looking for.
All the data is organized by topic, so you can quickly find what you’re looking for.
📌 Note: We don’t expect you to read this article from top to bottom, that’s why some data points crop up multiple times in different relevant sections.
Agile adoption, transformation, and trends
Disciplines, departments, and Agile practices
Agile methodologies and frameworks
📊 Want even more stats with the ability to search and filter?
Leave your email address below to access a searchable and filterable Notion database with 300+ findings and statistics to browse.
Agile adoption, transformation, and trends
All the data and findings you need on agile adoption and agile effectiveness. We’ve also listed interesting – and reputable – stats on Agile transformations and culture.
🥰 Agile adoption statistics
The numbers below tell the story about agile’s uptake and the popularity of its frameworks, like the unstoppable rise of Scrum and the demise of Extreme Programming.
- Which agile methodology do you follow most closely at the team level?
- 66% Scrum
- 9% Scrumban
- 6% Scrum/XP Hybrid
- 6% Kanban
- 5% Other
- 4% Iterative
- 2% Don’t know
(Source: Digital.ai)
- Agile adoption in software teams increased from 37% in 2020 to 86% in 2021. (Source: Digital.ai)
- 91% of organizations state that it is a strategic priority to adopt Agile. (Source: KPMG)
- 81% of agile teams report using some version of Scrum, including Scrumban or a hybrid Scrum model. (Source: Digital.ai)
- Extreme Programming and Lean are two of the least popular Agile approaches in 2021, with only 1% of teams using each one. (Source: Digital.ai)
- The organizational areas and departments that have adopted agile:
- 86% Software development
- 63% IT
- 29% Operations
- 17% Marketing
- 17% Security
- 16% HR
- 11% Sales/Sales ops
- 10% Finance
- 10% Hardware development
- 6% Other
- 2% None
(Source: Digital.ai)
- The agile methodology marketing teams follow most closely:
- 53% Hybrid
- 19% Scrum
- 14% Kanban
- 8% Scrumban
- 4% Lean
- 2% Other
(Source: Agile Sherpas)
- The most significant agile adoption barriers are:
- Inconsistencies in processes and practices (46%)
- Cultural clashes (43%)
- General organizational resistance to change (42%)
- Lack of skills and experience (42%)
- Absence of leadership participation (41%)
- Inadequate management support and sponsorship (40%)
(Source: Digital.ai)
- By 2017, 80% of U.S. federal IT projects were characterized as agile or iterative, as compared with 10% in 2011. (Source: Deloitte)
- Africa has the highest agile culture score (79%) of all organizations interviewed across all continents. In North America, the agile culture score is reported at only 32%. Agile was the default way of working for 85% of our North American respondents, but clearly, the journey to an effective agile culture is far from complete. European respondents rated their organizations moderately, with an average score of 50%. (Source: JCURV)
✅ Agile effectiveness statistics
Agile might be popular, but does it really work? Here are the numbers you need to make your case.
- Teams doing full Scrum have 250% better quality than teams that don’t do estimating. (Source: CA Technologies)
- Building a strong agile culture in your organization will result in an increased commercial performance of 237%. (Source: JCURV)
- 70% of agile organizations say that agile helps them achieve a faster time to market. (Source: JCURV)
- 78% of Scrum practitioners would recommend the framework to colleagues, friends, or other professionals. (Source: Scrum Alliance)
- A comparison of the improvements versus the required effort for Scaled Agile Frameworks:
- 74% say improvements are higher than the effort
- 16% say improvements are a lot higher than the effort
- 9% say improvements are less than the effort
- 1% say improvements are a lot less than the effort
- 78% of U.S. government executives surveyed believe the use of agile and DevOps methodologies is having a significant positive impact on their organization. (Source: Deloitte)
- Teams that have regular sprint retrospectives have 24% more responsiveness and 42% higher quality with less variability than teams with infrequent or no retrospectives. (Source: CA Technologies)
- Business units that fully adopted agile before the Covid-19 pandemic outperformed units that hadn’t on customer satisfaction (93% agreed), employee engagement (76% agreed), and operational performance (93% agreed). (Source: McKinsey)
- 76% of respondents reported that Kanban was “effective” or “much more effective” than other methods/frameworks that they have used. (Source: Kanban University)
- Teams that adopt Scrum well can improve their productivity by 300% to 400%. The best teams can achieve productivity increases of up to 800% and replicate that success over and over again. They also end up more than doubling the quality of their work. (Source: Jeff Sutherland)
😎 Agile trends statistics
Here’s the data that shows what’s hot and happening on the agile scene.
- Agile adoption in software teams increased from 37% in 2020 to 86% in 2021. (Source: Digital.ai)
- Kanban boards for workflow management are now used by 61% of respondents, steadily increasing from 6% in the first survey. (Source: Digital.ai)
- The use of Scrum increased from 40% of respondents in the first survey to 66% in the most recent. Other approaches such as Extreme Programming (XP) dropped from use by almost a quarter of the respondents to less than 1% today. (Source: Digital.ai)
- Leaders are now regarded as less agile in their behaviors (44%) compared to 2020 (56%). (Source: JCURV)
- By 2017, 80% of U.S. federal IT projects were characterized as agile or iterative as compared with 10% in 2011. (Source: Deloitte)
- Business units that fully adopted agile before the Covid-19 pandemic outperformed units that hadn’t on customer satisfaction (93% agreed), employee engagement (76% agreed), and operational performance (93% agreed). (Source: McKinsey)
🌎️ Agile transformation statistics
Without culture change, agile transformations fail. Below are the insights you need about transformations and the importance of culture.
- How organizations measure the success of their agile transformations:
- 59% Customer/user satisfaction
- 58% Business value
- 50% Business objectives achieved
- 48% On-time delivery
- 48% Quality
- 41% Productivity
- 41% Organizational culture/morale
(Source: Digital.ai)
- 74% of organizations undergoing an agile transformation do not agree that their organization supports an agile culture. (Source: KPMG)
- Only 13% of respondents in a KPMG survey stated that top management fully supports their agile transformation. (Source: KPMG)
- 38% of respondents in a KPMG survey stated that their agile transformation has no support from top management. (Source: KPMG)
- 62% of top management believe agile has no implications for them. (Source: KPMG)
- While 68% of respondents agreed that they felt empowered by leaders, after adjusting for cognitive bias, the neuroscience analysis determined that just 17% of respondents really felt empowered. (Source: JCURV)
- Building a strong agile culture in your organization will result in an increased commercial performance of 237%. (Source: JCURV)
- Africa has the highest agile culture score (79%) of all organizations interviewed across all continents. In North America, the agile culture score is reported at only 32%. Agile was the default way of working for 85% of our North American respondents, but clearly, the journey to an effective agile culture is far from complete. European respondents rated their organizations moderately, with an average score of 50%. (Source: JCURV)
- Only slightly more than four in 10 respondents identify organizational culture as an agile adoption barrier. (Source: Digital.ai)
- Most-used frameworks for scaling agile:
- 37% SAFe
- 9% Scrum@Scale / Scrum of Scrums
- 6% Enterprise Scrum
- 5% Spotify Model
- 3% Agile Portfolio Management (APM)
- 3% Disciplined Agile (DA)
- 3% LeSS (Large Scale Scrum)
- 3% Nexus
(Source: Digital.ai)
📊 Want even more stats with the ability to search and filter?
Leave your email address below to access a searchable and filterable Notion database with 300+ findings and statistics to browse.
Disciplines, departments, and Agile practices
The sections below list the essential data on agile organized by discipline and department, like agile IT and marketing. We’ve also included a section on agile metrics and practices.
🧢 Agile skills and education statistics
Below is data from and about agile coaches and handy information for HR departments about salaries for agile roles.
- Only 17% of survey respondents agreed that their performance management systems support agile ambitions. (Source: KPMG)
- The organizational areas and departments that have adopted agile:
- 86% Software development
- 63% IT
- 29% Operations
- 17% Marketing
- 17% Security
- 16% HR
- 11% Sales/Sales ops
- 10% Finance
- 10% Hardware development
- 6% Other
- 2% None
(Source: Digital.ai)
- Educational backgrounds of Scrum Masters:
- 46.01% IT or software development
- 18.52% Engineering
- 14.91% Business, finance, or economics
- 7.88% Other
- 5.15% Social sciences
(Source: Scrum.org and Age of Product)
- When asked about their previous roles before becoming Scrum Masters, 31% said “Project Manager,” 25% “Software Developer,”9% “Business Analyst,” and 8% “QA.” (Source: Scrum.org and Age of Product)
- The number of certifications Scrum Masters hold:
- 55% One certification
- 22% Two certifications
- 11% Three certifications
- 6% Four certifications
- 3% Five certifications
- 3% Six certifications
(Source: Scrum.org and Age of Product)
- 22% of agile coaches report investing more than 21 hours per month in professional learning (Source: Scrum Alliance & Business Agility Institute)
- Agile coaches stated that the biggest challenges in their work are: leadership acting as a barrier to agility; resistance to change structures, culture, or mindset; lack of understanding of agile; remote working. (Source: Scrum Alliance & Business Agility Institute)
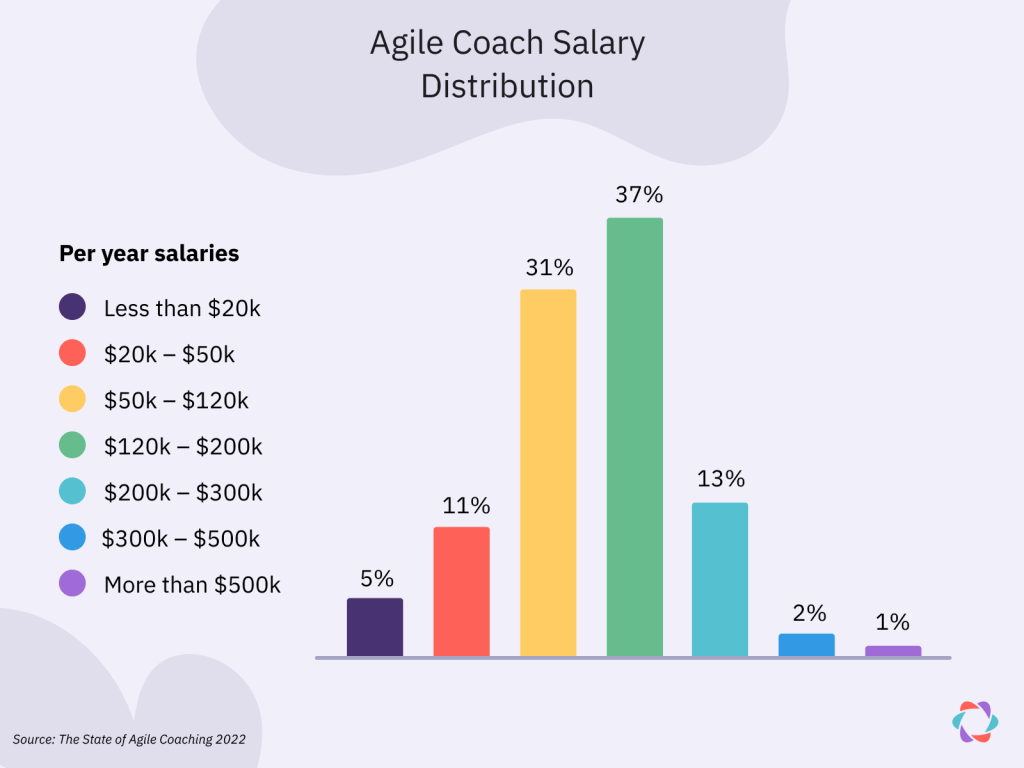
- 65% of coaches at organizations who had been on the agile journey for six years or more reported making more than $120K USD. (Source: Scrum Alliance & Business Agility Institute)
- 50% of agile coaches report salaries that range between $120K – $300K USD. (Source: Scrum Alliance & Business Agility Institute)
- 44% of Scrum Masters with a certification reported earning more than $100,000 USD, while only 18% of those without a certification were in that salary range. (Source: Scrum.org and Age of Product)
💻️ Agile IT statistics
These numbers show that IT is at the heart of agile. This department often leads agile initiatives within organizations and is responsible for the tools that enable agile practices.
- When Scrum Masters were asked which part of the organization is responsible for agile, they answered:
- 63% IT or Engineering
- 14% Project management office
- 10% Product management
- 13% Other
(Source: Scrum.org and Age of Product)
- Agile transformations are most commonly led by executive management (61%), Scrum Masters (48%), and IT managers (27%). (Source: Scrum Alliance)
- The organizational areas and departments that have adopted agile:
- 86% Software development
- 63% IT
- 29% Operations
- 17% Marketing
- 17% Security
- 16% HR
- 11% Sales/Sales ops
- 10% Finance
- 10% Hardware development
- 6% Other
- 2% None
(Source: Digital.ai)
- By 2017, 80% of U.S. federal IT projects were characterized as agile or iterative, as compared with 10% in 2011. (Source: Deloitte)
- 56% of organizations undergoing agile transformations believe their architecture and tooling do not support continuous delivery. (Source: KPMG)
- 64% of teams say the most important reason for adopting agile was to enhance their ability to manage changing priorities and accelerate software delivery. (Source: Digital.ai)
- Most important measures of success for DevOps implementations:
- 67% Accelerated delivery speed
- 61% Improved quality
- 47% Reduced risk
- 45% Increased customer satisfaction
- 43% Improved relationship between “Dev” and “Ops”
(Source: Digital.ai)
- Teams with no testers (compared to teams with testers) have the best productivity and almost as good quality, but there’s a much wider variation in that quality. (Source: CA Technologies)
- Reasons for adopting agile within a team or organization:
- 64% Enhance ability to manage changing priorities
- 64% Accelerate software delivery
- 47% Increase team productivity
- 47% Improve business and IT alignment
- 42% Enhance software quality
- 41% Enhance delivery predictability
- 40% Improve project visibility
(Source: Digital.ai)
🏔️ Agile leadership statistics
Teams and coaches often mention executives and other leaders as bottlenecks in agile initiatives. Sadly, the following data backs up this sentiment.
- Only 13% of respondents in a KPMG survey stated that top management fully supports their agile transformation. (Source: KPMG)
- Leaders believe they are effective agile leaders, but their employees disagree. 72% of senior leadership team respondents believed that the organization’s leaders were successfully applying agile ways of working. This attitude wasn’t mirrored business-wide, however, with only 56% of C-suite team members agreeing with the statement and just 34% of delivery team members. (Source: JCURV)
- 62% of top management believe agile has no implications for them. (Source: KPMG)
- 38% of respondents in a KPMG survey stated that their agile transformation has no support from top management. (Source: KPMG)
- Leaders are now regarded as less agile in their behaviors (44%) compared to 2020 (56%). (Source: JCURV)
- Only 11% of organizations state that top management has significantly changed their way of working to embrace agile. (Source: KPMG)
- While 68% of respondents agreed that they felt empowered by leaders, after adjusting for cognitive bias, the neuroscience analysis determined that just 17% of respondents really felt empowered. (Source: JCURV)
- Top-down command-and-control management is seen as the biggest tension between Scrum teams and organizations by 64% of people. (Source: Scrum Alliance)
- The most significant agile adoption barriers are:
- Inconsistencies in processes and practices (46%)
- Cultural clashes (43%)
- General organizational resistance to change (42%)
- Lack of skills and experience (42%)
- Absence of leadership participation (41%)
- Inadequate management support and sponsorship (40%)
(Source: Digital.ai)
- 78% of U.S. government executives surveyed believe the use of agile and DevOps methodologies is having a significant positive impact on their organization. (Source: Deloitte)
📣 Agile marketing statistics
Agile marketing still sounds like a strange niche to many in the broader community of agilists. But the information below shows that many marketers embrace agile and are getting serious about its practices.
- The agile methodology marketing teams follow most closely:
- 53% Hybrid
- 19% Scrum
- 14% Kanban
- 8% Scrumban
- 4% Lean
- 2% Other
(Source: Agile Sherpas)
- The biggest barriers preventing marketing departments from fully implementing agile are a lack of training or knowledge about agile approaches (43%), their current process is working well enough (29%), and lacking the right talent to transform the team to agile (29%). (Source: Agile Sherpas)
- The agile techniques and practices marketing teams use:
- 58% Sprint/iteration planning
- 57% Daily standup
- 45% Sprint/iteration review
- 44% Digital Kanban board
- 42% User stories and/or epics
- 41% Retrospectives
(Source: Agile Sherpas)
- Marketers see the main benefits of agile as enhancing their ability to manage changing priorities (65%), improving productivity (58%), and accelerating delivery (56%). (Source: Agile Sherpas)
- Challenges marketing teams face with using agile are difficulties managing unplanned work (44%), people reverting to old (non-agile) approaches (36%), and challenges with agile teams interacting with non-agile teams (31%). (Source: Agile Sherpas)
- 55% of Agile marketers said that implementing a project management tool was the most valuable thing in their agile transformation (Source: Agile Sherpas)
- While 65% of marketers cite the need to manage shifting priorities as a key driver for agile transformation, 44% continue to struggle with unplanned work after implementing it. (Source: Agile Sherpas)
- Agile marketing has changed marketing budgeting:
- 6% Annual budgeting is no longer sufficient, and budgets are now routinely reviewed and revised semi-annually.
- 27% Annual budgeting is no longer sufficient, and budgets are now routinely reviewed and revised quarterly.
- 39% We dynamically reallocate budget on an ongoing basis.
- 26% There has been no change in our marketing budgeting approach.
(Source: Agile Sherpas)
- The organizational areas and departments that have adopted agile:
- 86% Software development
- 63% IT
- 29% Operations
- 17% Marketing
- 17% Security
- 16% HR
- 11% Sales/Sales ops
- 10% Finance
- 10% Hardware development
- 6% Other
- 2% None
(Source: Digital.ai)
- Percentage of teams that use agile in these specific marketing activities:
- 77% Creative services, content creation, and operations
- 76% Demand and ABM
- 72% Website
- 66% Social media
- 62% Portfolio and product marketing
- 56% Channel marketing
- 54% Advertising
- 54% Customer engagement
- 52% Events
- 44% Brand management
(Source: Agile Sherpas)
- 38% of marketing teams believe that the Covid-19 pandemic accelerated their plans to adopt agile ways of working. (Source: Agile Sherpas)
❤️ Agile HR statistics
Agile HR, like agile marketing, is a growing field and emerging discipline. Many agile HR transformations are just beginning.
- A survey of 253 HR leaders revealed that 63% of them already use some variation of agile methods and principles (Source: Gartner)
- In 2022, 69% of HR leaders said that agile ways of thinking working and organizing are used in their organization outside of software development, compared to 63% in 2021. (Source: State of Agile HR)
- HR leaders state that the top reason for adopting agile is motivating current employees. (Source: State of Agile HR)
- 31% of HR leaders said they use Scrum, and 18% said they use Kanban. Only 1% use SAFe (Source: State of Agile HR)
- Only 42% of HR leaders said their organization has an “Agile HR” strategy. Of those, 84% said theur strategy was clear and 5% said it was unclear. (Source: State of Agile HR)
- HR leaders rates “role clarity” and “more focus” as the top benefits of using agile in their function. (Source: State of Agile HR)
- Agile HR practitioners said the top success factor for agile HR is “transparency in the flow of work” (30%) and adopting an “agile mindset” (13%). 20% of participants said they didn’t have enough experience to answer. (Source: State of Agile HR)
- 65% of HR leaders believe the Covid-19 pandemic positively influenced the transformation towards agile HR. (Source: State of Agile HR)
📈 Agile metrics statistics
Who does which agile practice, and how do teams measure their progress? Here are the numbers about agile metrics.
- 27% of teams say that having no clearly defined metrics to measure success holds back agile transformations. (Source: Scrum Alliance)
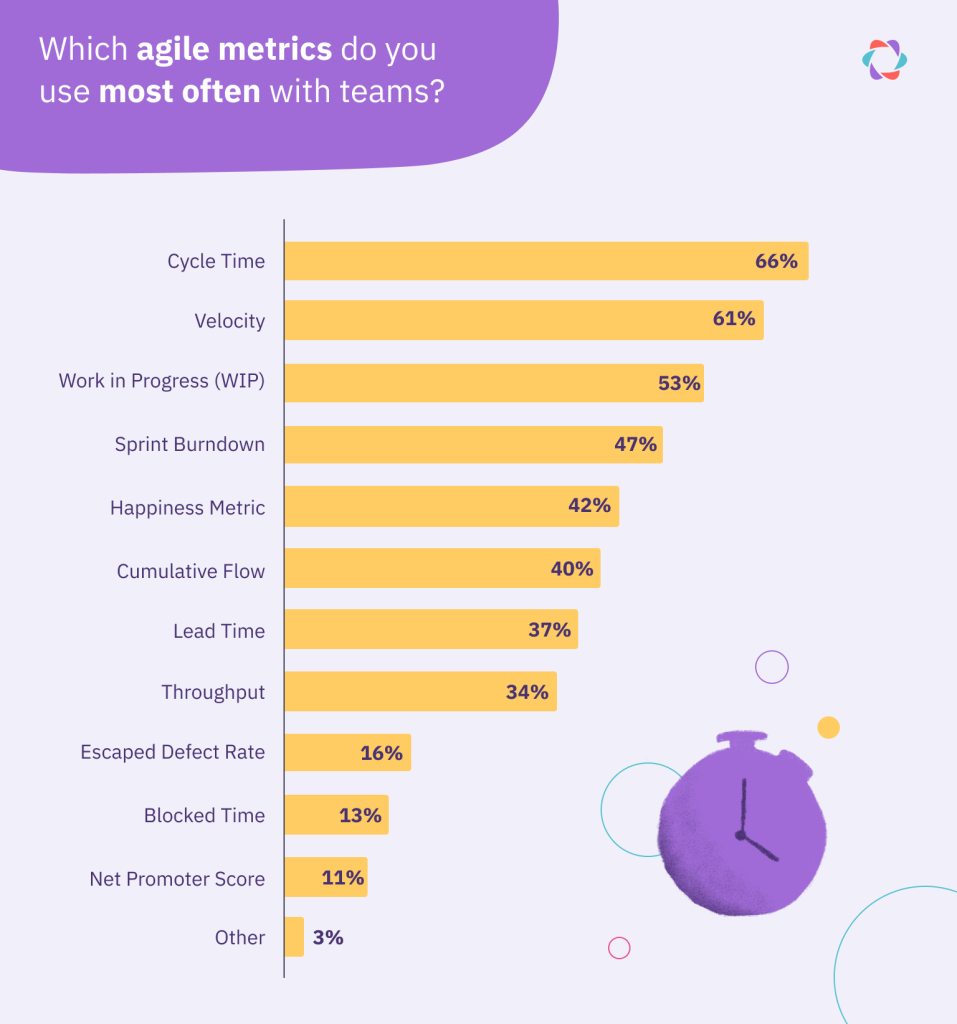
- According to agile coaches surveyed by Parabol, Cycle Time is the most commonly used agile metric (66%), followed by Velocity (61%) and Work in Progress (53%). (Source: Parabol)
- Teams that aggressively control Work in Progress (WiP) cut time in process in half and have only one-quarter as many defects but 34% lower productivity. (Source: CA Technologies)
- Agile coaches rated Sprint Velocity as the agile metric most likely to be unhelpful. (Source: Parabol)
- Kanban boards for workflow management are now used by 61% of respondents, steadily increasing from 6% in the first survey. (Source: Digital.ai)
- How marketing measure the results of adopting agile:
- 53% Effectiveness (e.g., increased engagement, greater pipeline/revenue contribution, etc.)
- 50% Efficiency (e.g., faster cycle time, greater output per cycle, etc.)
- 44% Management value (e.g., ability to meet goals, data-driven decision-making, etc.)
- 36% Team value (e.g., knowledge and application of agile concepts, improved capacity, etc.)
- 29% Stakeholder value (e.g., increased customer satisfaction, increased resource utilization, etc.)
- 14% We do not measure agile marketing results (Source: Agile Sherpas)
📆 Agile meetings statistics
Agile teams of every flavour run meetings, like retrospectives, planning poker, standups, and others. Here are all the stats on how they run meetings and whether they are effective.
- 81% of Scrum teams report holding a retrospective after every sprint. (Source: Scrum Alliance)
- Teams that have regular sprint retrospectives have 24% more responsiveness and 42% higher quality with less variability than teams with infrequent or no retrospectives. (Source: CA Technologies)
- 86% of Scrum teams hold a sprint planning meeting. (Source: Scrum Alliance)
- Teams that conduct effective retrospectives have a 20% higher balanced performance than teams that don’t conduct retrospectives. (Source: CA Technologies)
- 83% of Parabol users said that its sprint retrospective tool, sprint poker tool, and standup tool made meetings more fun, and 74% said it made the work of their team more inclusive. (Source: Parabol)
- 92% of Parabol users said the agile meeting tool made meetings more efficient, and 73% said it reduced meeting prep time. (Source: Parabol)
- Agile teams reported running the following meetings synchronously vs asynchronously:
- Retrospectives: 91.7% synchronous, 9.5% asynchronous
- Sprint planning: 64% synchronous, 8.9% asynchronous, remainder do not run this meeting
- Standups: 61.6% synchronous, 12.2% asynchronous, remainder do not run this meeting
- Backlog refinement: 51.8% synchronous, 18.5% asynchronous, remainder do not run this meeting
- Sprint reviews: 53.9% synchronous, 6.5% asynchronous, remainder do not run this meeting
- Planning Poker: 45.8% synchronous, 13.4% asynchronous, remainder do not run this meeting (Source: Parabol)
📊 Want even more stats with the ability to search and filter?
Leave your email address below to access a searchable and filterable Notion database with 300+ findings and statistics to browse.
Agile methodologies and frameworks
The sections below list data and findings by agile methodologies and frameworks, like Scrum and Kanban.
🏉 Scrum statistics
Scrum is by far the most popular agile methodology. The data below backs this up and shows how teams use and apply this method.
- 81% of agile teams report using some version of Scrum, including Scrumban or a hybrid Scrum model. (Source: Digital.ai)
- The use of Scrum increased from 40% of respondents in the first survey to 66% in the most recent. Other approaches such as Extreme Programming (XP) dropped from use by almost a quarter of respondents to less than 1% today. (Source: Digital.ai)
- Which agile methodology do you follow most closely at the team level?
- 66% Scrum
- 9% Scrumban
- 6% Scrum/XP Hybrid
- 6% Kanban
- 5% Other
- 4% Iterative
- 2% Don’t know
(Source: Digital.ai)
- 81% of Scrum Masters use Scrum and Kanban together. 54% use Scrum with DevOps. (Source: Scrum.org and Age of Product)
- Teams doing full Scrum have 250% better quality than teams that don’t do estimating. (Source: CA Technologies)
- 78% of Scrum practitioners would recommend the framework to colleagues, friends, or other professionals. (Source: Scrum Alliance)
- Teams that adopt Scrum well can improve their productivity by 300% to 400%. The best teams can achieve productivity increases of up to 800% and replicate that success over and over again. They also end up more than doubling the quality of their work. (Source: Jeff Sutherland)
- 85% of Scrum practitioners state that it improved the quality of their work life. (Source: Scrum Alliance)
- 87% of Scrum teams hold a Daily Scrum meeting. (Source: Scrum Alliance)
- Iterations (sprint) lengths Scrum teams use:
- 6.2% One week
- 59.1% Two weeks
- 23.4% Three weeks
- 9.8% Four weeks
- 1.5% Five or more weeks
(Source: CA Technologies)
🌀 Kanban statistics
Kanban is mainly known for its taskboard with columns. But there’s much more to the practice, and the statistics below show more teams are discovering Kanban’s benefits.

- 76% of respondents reported that Kanban was “effective” or “much more effective” than other methods/frameworks that they have used. (Source: Kanban University)
- 84% of respondents in a KPMG survey stated that they use either Scrum or Kanban in their organization. (Source: KPMG)
- 41% of organizations surveyed were applying Kanban across 10+ teams or to the whole company. (Source: Kanban University)
- The main reasons teams and organizations adopt Kanban:
- 78% Improve visibility of work
- 56% Continuous improvement
- 44% Increase delivery speed/throughput
- 42% Improve lead time
- 40% Improve responsiveness to business needs
(Source: Kanban University)
- The starting point for teams when they began with Kanban:
- 44% Scrum
- 25% Waterfall
- 21% Unknown
- 2% SAFe
- 2% XP
- 1% CMMi
(Source: Kanban University)
- Results from adopting Kanban:
- 78% Increased visibility of flow
- 52% Improved delivery speed/throughput
- 44% Alignment between business objectives, key results, and delivery work
- 42% Improved predictability
(Source: Kanban University)
- Kanban boards for workflow management are now used by 61% of respondents, steadily increasing from 6% in the first survey. (Source: Digital.ai)
- The types of Kanban boards organizations use (in order of board complexity):
- 2% Not sure
- 10% Simple “to do-doing-done” board
- 37% Intermediate Kanban board (with more than three columns and swim lanes)
- 17% Multiple connected Kanban boards
- 24% 2-tiered Kanban board
- 10% A network of services
(Source: Kanban University)
- Challenges teams have experienced when adopting Kanban:
- 48% Lack of skills / experience with Kanban
- 45% Organizational resistance to change
- 42% Inconsistent processes and practices across teams
- 33% Team resistance
- 31% Fragmented tooling and measurements
(Source: Kanban University)
- Teams that aggressively control Work in Progress (WiP) cut time in process in half and have only one-quarter as many defects but 34% lower productivity. (Source: CA Technologies)
🏢 SAFe and Scaled Agile statistics
SAFe is the Scrum of scaling agile, the most used method for rolling out agile at large organizations. And despite the many haters the framework has, the data below shows that many folks find that it’s working.
- 44% of organizations find scaling agile beyond the team level to be one of the main challenges in agile transformation. (Source: KPMG)
- Most-used frameworks for scaling agile:
- 37% SAFe
- 9% Scrum@Scale / Scrum of Scrums
- 6% Enterprise Scrum
- 5% Spotify Model
- 3% Agile Portfolio Management (APM)
- 3% Disciplined Agile (DA)
- 3% LeSS (Large Scale Scrum)
- 3% Nexus
(Source: Digital.ai)
- Nearly 50% of Scrum Masters surveyed reported using a scaling framework for their agile practices. SAFe, LeSS, and Nexus were the most popular. While 71% of participants use a single scaling framework, 29% use more than one. (Source: Scrum.org and Age of Product)
- 35% of teams use a custom or tailored method to scale agile across their organization. (Source: IPMA World and University of Applied Sciences Koblenz)
- A comparison of the improvements versus the required effort for Scaled Agile Frameworks:
- 74% say improvements are higher than the effort
- 16% say improvements are a lot higher than the effort
- 9% say improvements are less than the effort
- 1% say improvements are a lot less than the effort
- 52% of Australian respondents reported that adopting agile methods had improved their individual project delivery capability, but only 37% identified that their organizational project management capability had improved by adopting agile. (Source: KPMG and AIPM)
🎡 Agile frameworks statistics
Here’s information on other agile approaches, like DevOps and Value Stream Management (VSM).
- Most important measures of success for DevOps implementations:
- 67% Accelerated delivery speed
- 61% Improved quality
- 47% Reduced risk
- 45% Increased customer satisfaction
- 43% Improved relationship between “Dev” and “Ops”
(Source: Digital.ai)
- 75% of respondents indicate DevOps is important or very important to their organization, with only 9% stating it has no importance. (Source: Digital.ai)
- 81% of Scrum Masters use Scrum and Kanban together. 54% use Scrum with DevOps. (Source: Scrum.org and Age of Product)
- 68% of Australian organizations are using a full or mix of agile and waterfall methodologies. (Source: KPMG and AIPM)
- Two-thirds of organizations are involved with implementing or planning a Value Stream Management (VSM) initiative. (Source: Digital.ai)
⚒️ Agile tools and market statistics
The Agile Manifesto talks about “individuals and interactions over tools and processes”, but the agile tools market is growing in size and popularity.
- The global enterprise agile transformation services market was valued at $15,443.51 million in 2018, and is projected to reach $63.8 billion by 2026, growing at a CAGR of 19.50% from 2019 to 2026. (Source: Allied Market Research)
- 56% of organizations undergoing agile transformations believe their architecture and tooling do not support continuous delivery. (Source: KPMG)
- 55% of Agile marketers said that implementing a project management tool was the most valuable thing in their agile transformation. (Source: Agile Sherpas)
- 83% of Parabol users said that its sprint retrospective, sprint poker, and standup tools made meetings more fun, and 74% said Parabol makes the work of their team more inclusive. (Source: Parabol)
- 92% of Parabol users said the agile meeting tool made agile meetings more efficient, and 73% said it reduced meeting prep time. (Source: Parabol)
Want even more Agile statistics?
During our research we found 300+ stats in total. It was simply too many to include in one article! So if you’re still looking for that golden nugget of information to perfect your article, paper, or presentation, do not fear!
We’ve curated, labeled, and organized all the extra information into a searchable database.
📚 Get access to the complete data set 📚
Drop in your email and we’ll give you access within one working day
Are we missing some data? Want us to feature your report? Send a note to love@parabol.co!

Tim Metz
Tim Metz crafts content at Animalz for the world’s most amazing startups. He’s passionate about deep work and work-life balance.