The 10 Most Helpful Agile Metrics According to Experts

Cumulative Flow Diagram. Work In Progress. Quality Intelligence. Planned-to-done-ratio. Velocity. Flow Debt. Work Item Age. Burndown chart. Burnup chart.
It’s easy to find a list of agile metrics online and start tracking them all. The challenge is identifying which ones will add value to your team.
As with all things Agile, opinions abound about the pros and cons of different metrics. And when you ask an Agile Coach which to track, more often than not, you’ll hear them say… “it depends”. Because it does! So where should you start?
We surveyed dozens of Agile coaches, Scrum Masters, and other practitioners to discover the ten agile metrics they most often use with their teams.
Then, we solicited their expert advice on how and when to use each, so you can understand which metrics to use in which scenarios and develop an informed selection for your team.
What are Agile Metrics?
“In theory, there is no difference between theory and practice. In practice there is.”
Benjamin Brewster
In an ideal world, an agile metric is a number that tells the development team the status or performance of an outcome that’s important to them as an Agile team.
What makes a metric Agile is whether it aligns with the Agile manifesto and tracks how effectively a team fulfils one or multiple of its principles and values.
For example:
- One Agile principle is to satisfy customers through continuous delivery of valuable work. So the corresponding Agile metric might be a customer satisfaction score.
- Another principle is to maintain a constant pace for completed work. So the corresponding Agile metric could be how long it takes a team to finish tasks (cycle time), or how long items remain in progress, etc.
In the real world, metrics are sometimes used – even “weaponized” in the words of one expert – against teams to set targets, rewards, and even punishments.
The conflict between how agile metrics should be used (to benefit the team) and how they are traditionally used (to the benefit of higher-ups) arises from the longstanding focus of managers on output and enforcing predictability.
One key difference with agile metrics is that they should be primarily useful for the team, rather than anyone higher up. Instead of creating aspirational goals, they focus on realistic predictability. The focus is on helping a team improve their work continuously over time.
For example: A traditional manager, for example, may insist on specific deadlines for tasks, which a team then gives but hardly ever meets. An agile metric like Cycle Time would solve this by predicting delivery based on actual past performance, like “90% of our tasks finish within two weeks.”
What are the most popular Agile metrics?
We found that the 10 most popular Agile metrics are:
- Cycle time
- Velocity
- Work in Progress (WIP) / WIP limits
- Sprint burndown
- Happiness
- Cumulative flow
- Lead time
- Throughput
- Escaped defect rate
- Blocked time
We compiled this list by surveying 38 Agile practitioners from around the world – including South Africa, Australia, the United Kingdom, India, Vietnam, and the USA – to determine the ten agile metrics they use most with their teams.
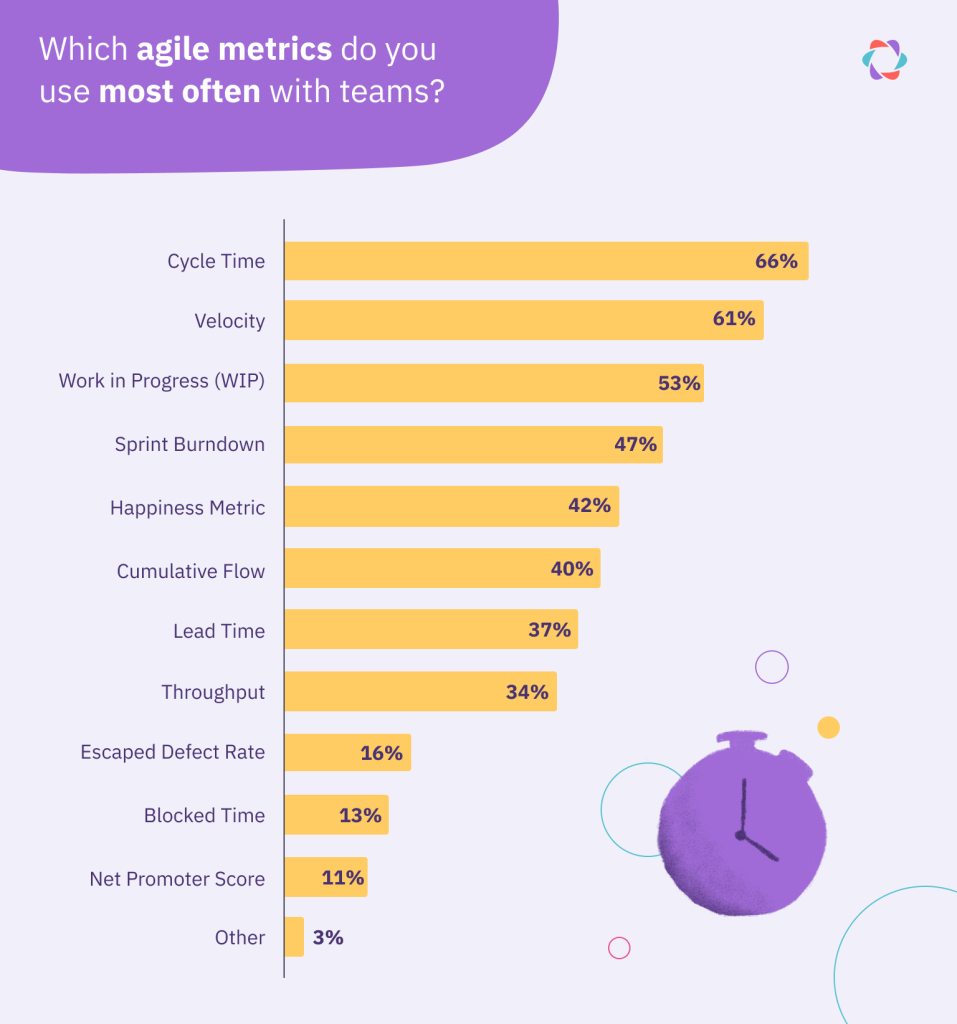
Note: Participants were able to select multiple options
Let’s cover these Agile metrics to understand better what they set out to track and why practitioners use them so often.
1. Cycle time
Cycle time measures how long it takes a team to complete tasks. You can measure cycle time by tracking how much time tasks spend in the “in progress” stage of your Kanban or Sprint board.
You can single out any items with an anomalously high time to completion for further discussion.
Cycle time is a helpful metric because it conveys a lot of information about:
- Productivity: Teams with short cycle times complete more items than teams with longer cycle times.
- Story size: When task or story sizes are small, Cycle Time goes down. It can help identify issues where a team is taking on chunks of work that are too big.
- Predictability: Teams with consistent cycle times can give more reliable forecasts on how long it takes them to complete work.
- Delays: Teams with increasing or varying cycle times can use the number to identify where and why delays happen.
- Time to feedback: The longer a team’s Cycle Time, the longer it takes to get feedback from customers on product updates.
- Cost: Almost without exception, longer Cycle Time equates to higher development costs.
Cycle Time was by far the most popular Agile metric selected by Agile Coaches, Scrum Masters, and other Agile practitioners.
2. Velocity
Velocity is calculated as the number of estimated story points a team completes during a Sprint or other period of work. It is usually measured per Sprint.
Average Velocity tracked over a longer period can help the team reliably forecast how much work they can do in one Sprint. This may then be factored into Sprint Planning.
For example:
“We know we can reliably complete 50 story points of work per sprint. So let’s check how much we’ve taken off the Product Backlog for this Sprint to see if we’re roughly on track”
Velocity can also signal issues or areas for improvement when the number goes up or down.
While Velocity was the second most popular metric in our survey of most helpful Agile metrics, it was also the Agile metric one most commonly mentioned as unhelpful.
As with all Agile metrics, its utility depends on how it’s deployed. Measuring Velocity can be incredibly helpful and empowering for teams, but when they become fixated on keeping the velocity up for the sake of satisfying “velocity goals”, then it becomes counter-productive and prone to manipulation by the team.
3. Work In Progress (WIP)
Work In Progress (WIP) can be calculated as the total number of items a team is working on at any given time.
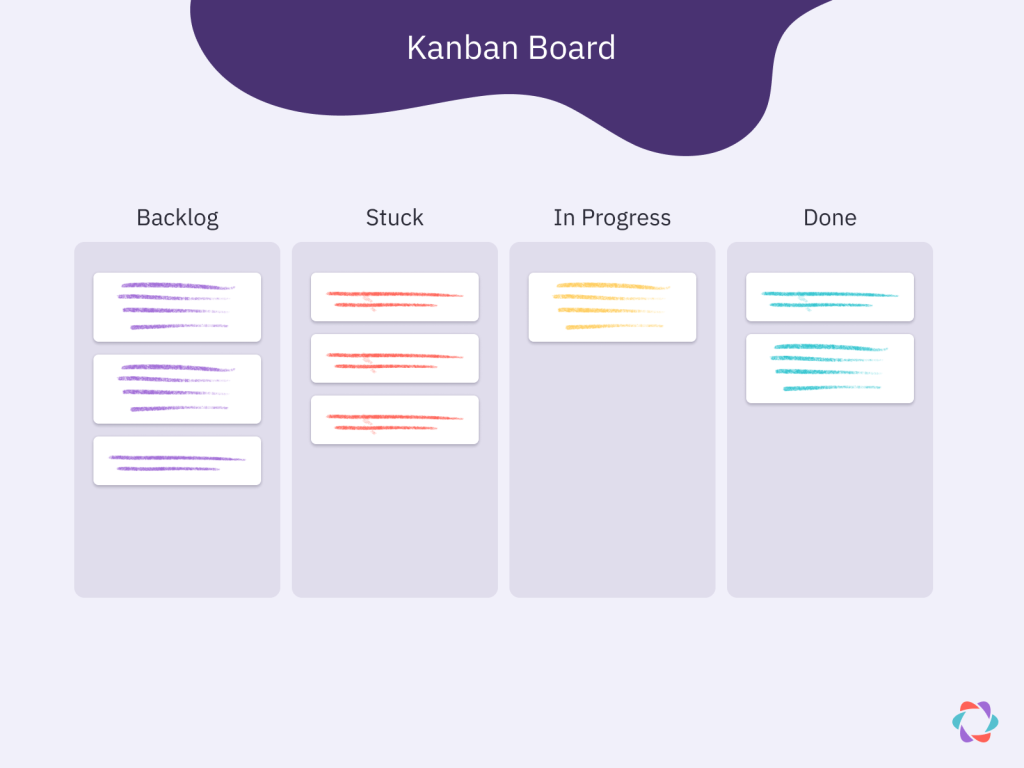
WIP is a critical metric for keeping teams focused and ensuring a continuous flow of work. Teams can calculate this by noting how many items sit in the WIP or “In Progress” column of their Kanban board or Scrum board.
- A high WIP number often signals a team is overcommitted and not using their time efficiently.
- A low WIP number indicates that work flows through the system quickly, and a team is completing tasks with few blockers. Having a low WIP number also indicates that a team is losing less time to context-switching, because it shows that every task is efficiently worked to completion before a new one is selected.
WIP is especially powerful when teams take a Kanban-style approach and set a maximum number of items they can have in progress simultaneously.
This limit forces prioritization discussions. When someone wants to add a new item to the WIP column, they need to make space for it by finishing another task first or moving one to the Product Backlog.
4. Sprint Burndown (chart)
A Burndown chart visually presents how many story points a team has completed during a Sprint and how many remain to be completed. Usually, the chart has an “ideal burndown” line that shows the progress needed to arrive at zero remaining story points by the end of the reporting period, and an “actual burndown” in the form of remaining story points.

A Burn Chart – as it’s sometimes called – is helpful because it makes it easy for everyone to see whether the team is on track to reach the Sprint goal. It also visualizes when the team’s speed increases or decreases during a Sprint, which might be a signal to investigate further during the Sprint Retrospective.
A Burndown chart only shows how many story points the team has completed and how many remain. It doesn’t give any deeper indication of why that’s the case. A Burndown chart by itself is therefore not sufficient alone to determine whether a team is performing well or not.
5. Happiness metric
The Happiness metric is an indicator of how the team feels about their work. Jeff Sutherland, the creator of the Scrum framework, explains how it works in his book Scrum: The Art of Doing Twice the Work in Half the Time.
At the end of the Sprint, each team member answers four questions:
- On a scale from 1 to 5, how do you feel about your role in the company?
- On the same scale, how do you feel about the company as a whole?
- Why do you feel that way?
- What one thing would make you happier in the next Sprint?
This Agile metric brings the human, emotional side of any changes or struggles the team faces to the surface, which is impossible with the other metrics.
Teams can adapt the exercise above with whichever questions make most sense to them. You can also take Jeff Sutherland’s questions and focus them on the team rather than company-level.
6. Cumulative Flow Diagram
The Cumulative Flow Diagram (CFD) is a strange metric because… well, it’s actually diagram that pulls several metrics into one visual. That’s what makes it such a powerful tool, and why many in the Agile community list it among their favorite ways of tracking Agile metrics.
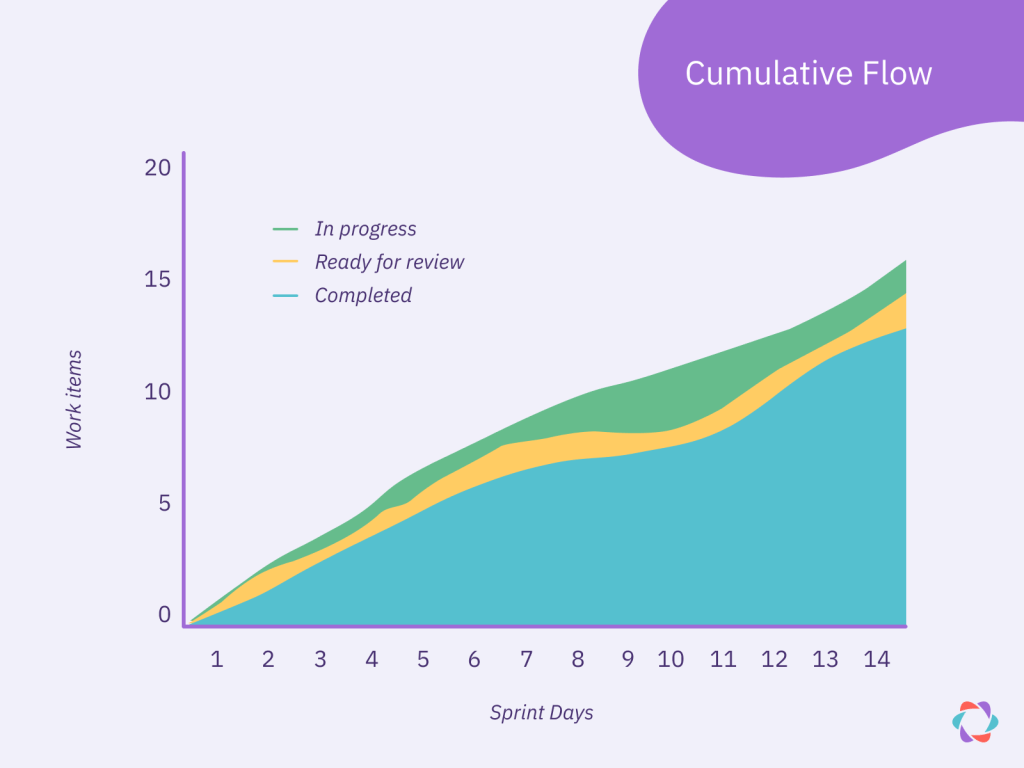
The x-axis in a CFD represents time, the y-axis represents work items, and each graphed series represents a stage of the work process. Through this visualization, you can instantly grasp how work is flowing through a system.
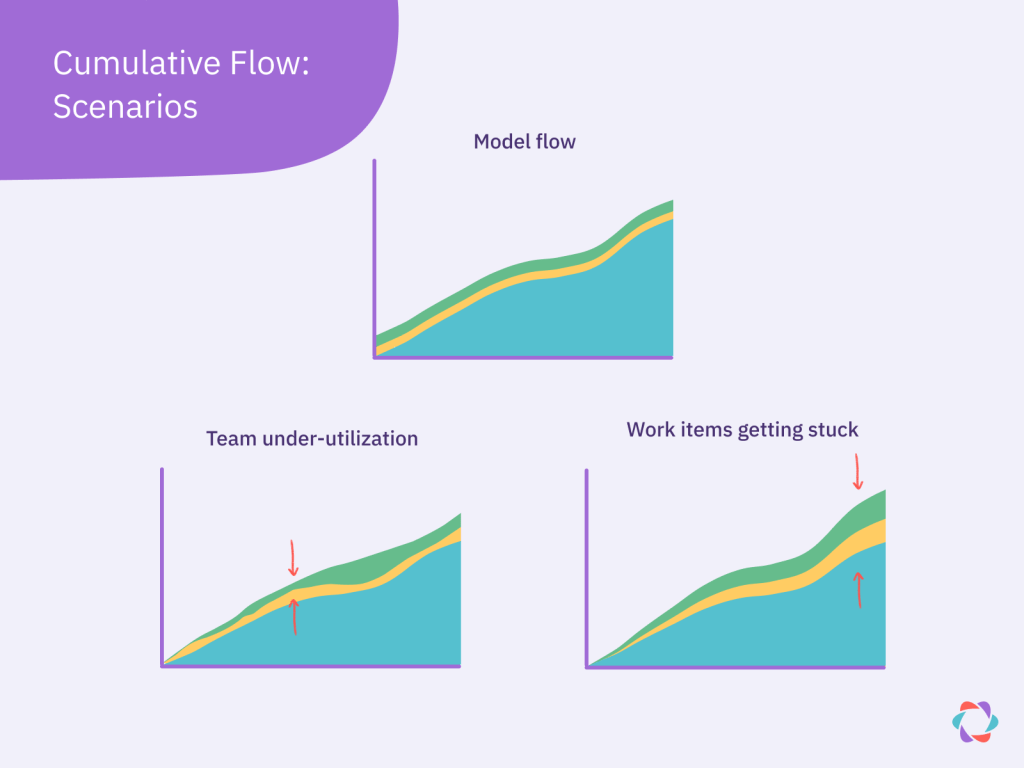
- When the bands increase in lockstep as per the “Model flow” below, work items get started and finished at an equal rate, which is ideal.
- Bands that widen indicate that items get stuck in your process (bottom right graph).
- Bands that narrow (bottom left graph) signal you have too few tasks, since items get completed faster than new ones arrive.
While CFDs can be overwhelming at first, they are helpful for communicating a lot of information quickly. At least after you’ve had a bit of practice with them. You can also measure the distance between two horizontal points, for example, to get Cycle Time. Do that vertically, and you can check your WIP at any point in time covered by the CFD.
The CFD is the Swiss army knife of Agile metrics.
📌 An excellent book that goes deep on Cumulative Flow Diagrams is Actionable Agile Metrics For Predictability: An Introduction by Daniel Vacanti.
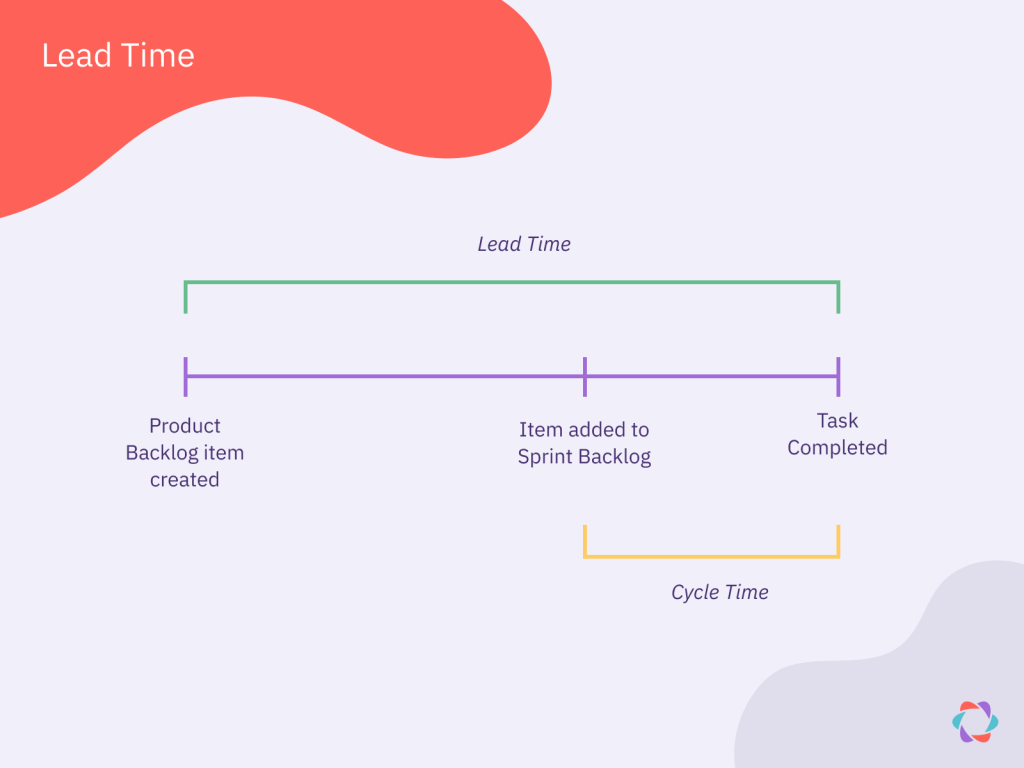
7. Lead time
Lead time is the entire period a work item spends in your process from the moment someone creates it. Essentially, it’s Cycle Time plus the time a task sits around in your Backlog waiting to get pulled into the WIP phase.
A focus on Lead time keeps the Backlog lean and clean. For some teams, this isn’t a worry, but it’s critical when you use the Backlog for prioritization and planning since you could have dozens or even hundreds of stale backlog items hanging around there.
8. Throughput
Throughput is the number of work (WIP) items the team completes in a specific period, usually measured per Sprint.
This metric is different from Velocity, which measures the number of story points delivered per work cycle. Since one work item usually represents multiple story points, the numbers differ.
As you measure average Throughput over many Sprints, the metric helps predict how many completed features or user stories a customer or other stakeholder can expect each Sprint.
A low Throughput can also indicate other issues, for example, that your team’s user stories are too big, which is a signal to start Story Splitting or to more broadly consider whether there’s a deficiency in the way your team estimates Story Points.
9. Escaped Defect Rate
The escaped defect rate measures the percentage of defects that are identified in work after code has shipped to production. It measures how many issues slip through QA testing.
Some teams only track problems found by customers and end-users. Others also include problems discovered during QA or other phases outside of the development team’s realm.
In Agile utopia, teams fix all problems before delivering a piece of work. In reality, this rarely happens. Without measuring the Escaped Defect Rate, it’s difficult to determine how many issues slip through the team’s process unnoticed.
The Escaped Defect Rate can be a good prompt for diagnosing problems and suggesting improvements in the team’s Sprint Retrospective.
10. Blocked time
Blocked time counts the time a work item can’t move forward, usually caused by a dependency or other issue outside the team’s control.
Blocked or Stuck items may have their own column on the Kanban board, making it relatively easy to calculate.
Often teams categorize blocked items by causes, then add up and track the total blocked time for each category to get a sense of persistent problem areas. This gives teams clear data from which to prioritize improvements.
Blocked time can be a great way to figure out bottlenecks and the root cause of delays. Such insight sometimes provides opportunities for improvement outside of the team’s direct control. For example, another department or external supplier consistently delivers their input or task requirements too late.
🏅 Honorable mentions
These two metrics didn’t make it into the top 10 but deserve a mention as they can prove valuable in the right circumstances:
- Release Net Promoter Score (NPS): NPS asks users how likely they are to recommend your product to a friend on a scale from one to ten. When you measure this score over time for every product release, you get a metric that closely reflects how much customer value you are delivering over time.
- DIY values and rating: One survey respondent suggested letting teams come up with a set of values they want to work by, then rate themselves on those values every Sprint. This practice is similar to Benjamin Franklin’s, who, as described in the book Daily Rituals, devoted himself to one virtue per week, successively making fewer and fewer “offenses” each week.
How to Pick Agile Metrics for your Team
Even if you could measure all of the above metrics simultaneously, that would be a bad idea. A team can only process and act on a few metrics at a time.
Focus on the few metrics that address your most pressing issues or goals. Here’s advice on picking the right ones, inspired by feedback from the experts we polled.
Determine the metric’s use case
Start by asking why you want to track a specific metric. What do you hope the number will accomplish? How will it be reported and visualized? What will you do with it?
Such questions might seem obvious, but often, a metric sounds helpful in theory but turns out to be unhelpful when you run it through one or two scenarios of how you intend to actually use it.
Pick just a handful of metrics
The fewer agile metrics you set for a team, the more attention they get. Or, as the old saying goes: “When everything is a priority, nothing is a priority.”
Think of metrics as an “overhead.” Every number you decide to track requires some effort to report on and causes noise and sometimes pressure for the team.
Select metrics that counterbalance each other
If one metric holds absolute power, its power will corrupt absolutely.
For example, if you choose to only focus on Cycle Time, and it decreases, you might think the team is improving their work processes. That’s until you check Team Happiness and realize it’s plummeting because excessive overwork is the real reason for shorter cycle times.
Another all-too-common example is fixating on increasing Velocity. When that happens, the team may feel pressurised and stress. But they may also be inclined to manipulate the metric by boosting their estimates of how many story points a task requires to complete.
Get input from the team
This recommendation from one expert is brilliant in its simplicity: Frequently ask the team which metrics they’re actually using. Which numbers sparked conversations, insights, or actions? Discard any metrics that didn’t.
Many Agile teams aim to be self-managed. In Scrum, it’s even explicitly stated. So give the team a say in what metrics they think they should be tracking. Since developers on a team are closest to the work, they may be best placed to come up with meaningful metrics.
Sprint Reviews and Retrospective meetings are the natural stage for agile metrics to make an appearance. If a specific metric isn’t coming up very often, ask the team if it’s still useful to them.
Make the metrics transparent and clear
Transparency is one of the core values of Agile. And that extends to your metrics! Many of the experts we surveyed also recommended that agile metrics be visible for everyone involved in a team. That helps create transparency which improves and speeds up communication, ensures problems can be identified faster, and avoids information hoarding or silos.
After making them visible, check that the team and stakeholders you work with all understand what each metric tracks and why. All that transparency isn’t much good if your team members don’t know what they’re looking at or why it’s being tracked! If anyone is confused about a particular metric, like Throughput or Cycle Time, you can always send them this article!
Beware the dark side of metrics
Even helpful metrics can inadvertently create anti-patterns when wrongly used. As the adage one expert invoked goes: “you get what you measure.”
Compare and rate teams on Velocity, and their numbers will converge. Judge Scrum Masters on the number of teams they work with, and that metric goes up. Reward predictability and it will increase, until it comes crashing down.
Agile metrics should serve a team, a purpose, and each other. That’s how to ensure they’re helpful, lead to continuously improving work processes, and, ultimately, more customer value and team happiness, the pinnacles of Agile.

Tim Metz
Tim Metz crafts content at Animalz for the world’s most amazing startups. He’s passionate about deep work and work-life balance.