#429 Simulating the Business
Friday Ship #429 | February 7th, 2025

This week we put the finishing touches on our fourth revision of our business model, allowing us to more accurately simulate our operations.
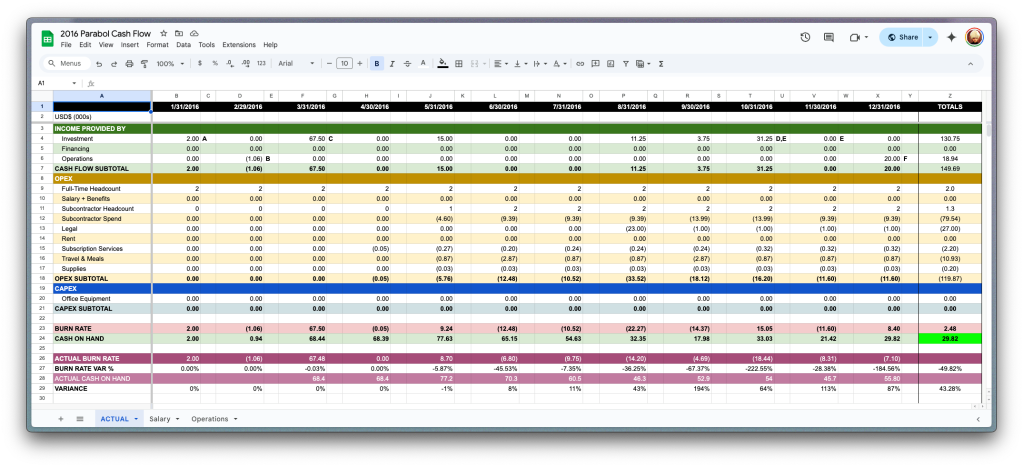
Shortly after Parabol was founded we needed a way to keep track of our finances. The business was fragile—often operating with no more than one or two months of cash on hand. Since there was so few of us, so few ways we took in income, and so few things we spent money on, we could track everything in a single spreadsheet. We relied on that spreadsheet for nearly four years.
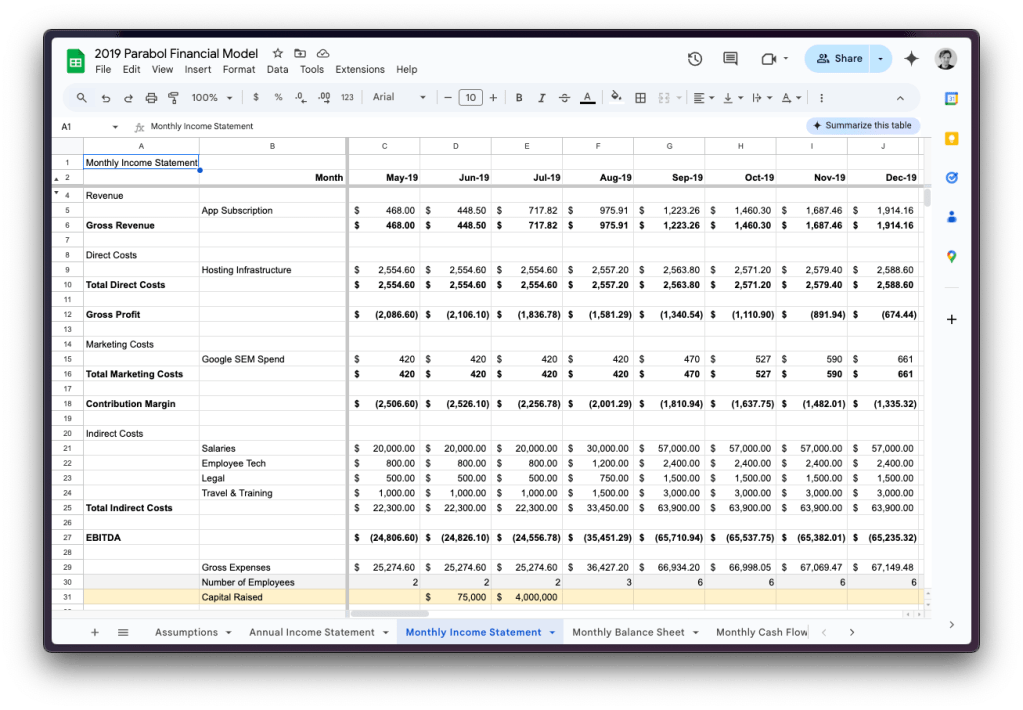
In 2019, when Parabol joined the Techstars Accelerator, we attended a session by Troy Henikoff Partner of MATH Ventures. Henikoff insisted that we develop a detailed financial model—not just as a tool for potential investors but as a simulation of our business. He encouraged us to build proper models for user and customer acquisition, SaaS dynamics (such as expansion, contraction, and churn), a P&L, Balance Sheet, Statement of Cash Flows, and projections for various expenses.
Our executive team used this model consistently. It enabled us to scenario plan and ask questions like:
“What would have a bigger impact on the business—improving website conversions or increasing in-product virality?”
With it, we set goals, planned hires and modeled compensation programs. We also compared our forecasts to actuals and made adjustments. The model became an essential tool for how we operate. However, as it grew—integrating inputs from accounting, personnel, and product reports—it also became a major pain to maintain.
Building a More Scalable Model
The third iteration of our financial model began in 2021 after hiring and onboarding our data team. The inputs we needed in the previous model drove the requirements for developing Parabol’s data warehouse, built on Google’s BigQuery. We elected to use BigQuery because it integrates seamlessly with Google Sheets, allowing us to use the same methods we had grown accustomed to for analyzing and playing with hypothetical business scenarios.

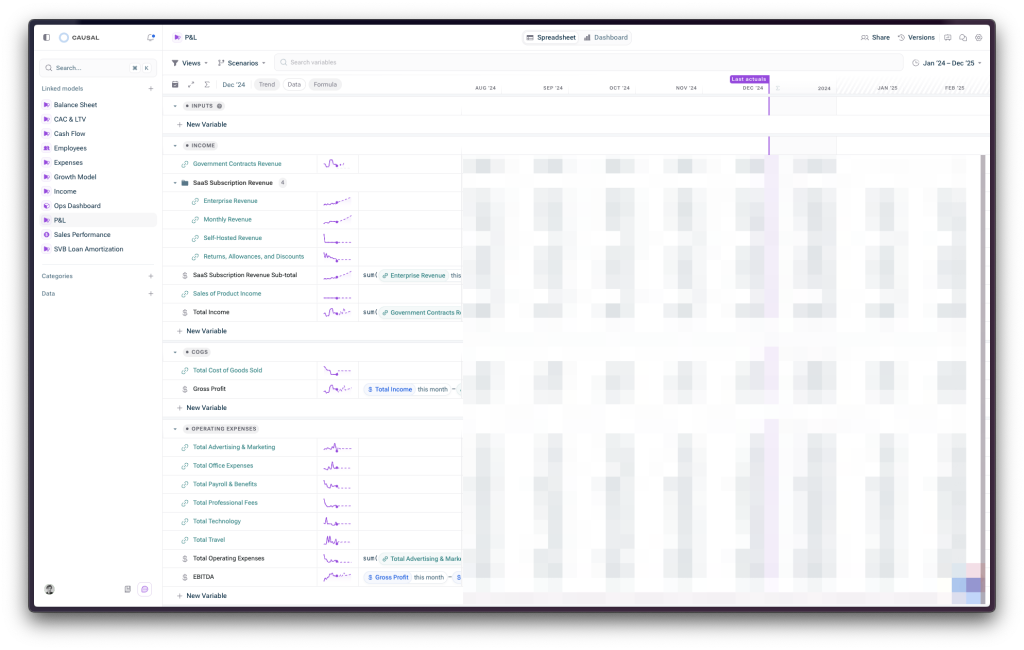
This model served us well—it helped us refine compensation plans, reduce expenses, and reach our ninth anniversary operating as a company. As useful as it was, as the volume of historical data grew, the model grew slower and clunkier to operate. What started as an effort to improve our user and customer acquisition modeling led to a major platform switch—our fourth model revision—moving from Google Sheets to Causal, a purpose-built financial planning tool.
Why We Chose Causal
Over the years, we evaluated several tools aiming to displacing spreadsheets as the preeminent modeling solution (such as Forecastr, Jirav, and Fathom). None stuck, even after having some of these organizations help build models for us. The plain truth was that none of these tools made modeling any easier than a spreadsheet.
The beauty of spreadsheets lies in their “sketchability”—the ability to try new ideas, abandoning what doesn’t work, and raising the fidelity of what does. Then, we met Causal.
At first, Causal-it just felt like an overpriced spreadsheet with some clever integrations (the Quickbooks integration was particularly good). However, after discussing with Taylor from our data team, he showed me the true power of Causal lay in its Categories, Time, and Uncertainty modeling—things that traditional spreadsheets and other modeling tools struggle with. For example, instead of writing a separate formula for every row in our chart of accounts, we could now write a single formula that applied across the board.
The Trade-Off: Cost vs Efficiency
Causal has significantly streamlined our financial modeling, but its expensive. Not only is each user seat monetized, but each integration comes at an additional cost.
To mitigate expenses, we spend additional developer time creating custom data marts in Google Sheets, allowing us to rely on only one Causal integration. Despite this, Causal has become an integral tool for how we run the business.
Metrics
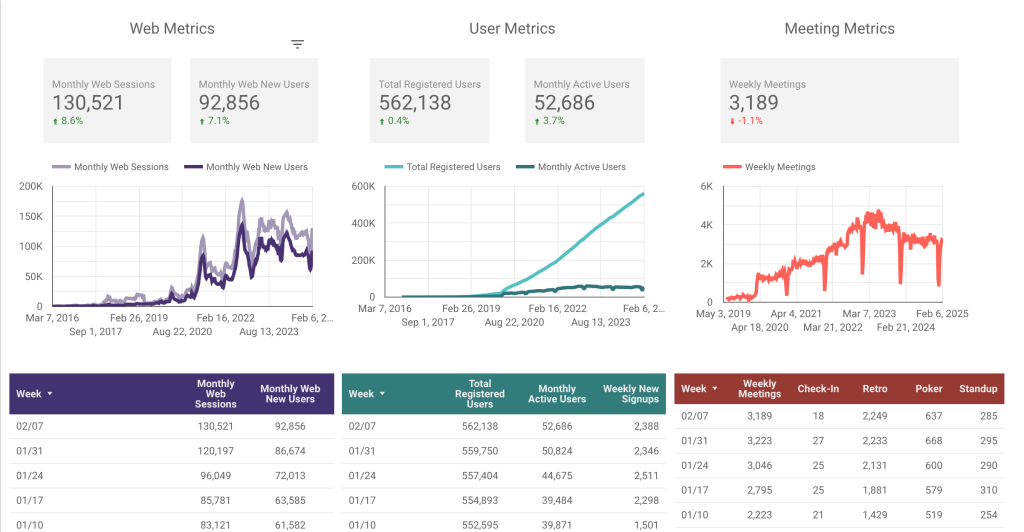
A fairly good week of metrics. We saw website traffic and signups pop after the winter holiday and show sustained growth until this week. Has the “get in shape for the New Year” effect worn off? We’ll be watching next weeks metrics to see!
This week we…
…overhauled the way we calculate post-sale account health. This deserves a Friday Ship post all its own! We’ve been working hard to improve the way our sales team prioritizes it time to build and maintain relationships with our customers.
…worked on designs for our next iteration of our Insights feature. We launched Team Insights into beta a few months ago-our next iteration will allow users to generate AI-driven insights across their teams.
Next week we’ll
…attend the Rocky Mountain Cyber Symposium in Colorado Springs.

Jordan Husney
Jordan leads Parabol’s business development strategy and engineering practice. He was previously a Director at Undercurrent, where he advised C-Suite teams of Fortune 100 organizations on the future of work. Jordan has an engineering background, holding several patents in distributed systems and wireless technology. Jordan lives and works in Los Angeles, CA.